
Social media engagement metrics are the vital signs of your online presence. For a founder, they're not just likes and shares; they're direct signals from your market telling you if your message is landing.
These aren't abstract numbers. They are clues that reveal whether you're building a real community or just shouting into the void. At BillyBuzz, we treat them as early indicators of product-market fit.
Stop Chasing Vanity Metrics and Start Measuring Growth
As a founder, your time is your most valuable asset. The biggest time-sink in social media is chasing stats that look good but do nothing for your bottom line. This is the classic trap of vanity vs. actionable metrics, and learning the difference is non-negotiable.
At BillyBuzz, we made this mindset shift early on. We stopped celebrating follower milestones and got obsessed with the quality of conversations our content sparked.
It’s simple: would you rather give a speech to a massive, distracted stadium, or lead a small workshop where every person is hanging on your every word? We'll take the workshop every time.
The Mindset Shift from Followers to Conversations
Vanity metrics like total followers or page likes are tempting. They're simple, satisfying, and offer a quick ego boost. But a huge following that never interacts is an empty room. These numbers don't tell you if your product resonates or if you're building a tribe of loyal fans.
Actionable metrics show you who's actually listening. These are the engagement metrics social media pros live by: thoughtful comments, enthusiastic shares, and DMs that start real sales dialogues. Each one signals a much deeper connection than a passive 'like'. To truly stop chasing vanity metrics and start measuring growth, it's essential to thoroughly understand a comprehensive guide to social media engagement metrics.
It's crucial to distinguish between metrics that merely look good and those that signify genuine audience investment. This table breaks down the difference.
Vanity vs Actionable Engagement Metrics
| Metric Category | Vanity Metric Example (Low Signal) | Actionable Metric Example (High Signal) |
|---|---|---|
| Audience Size | Total Followers / Page Likes | Active Daily/Monthly Users |
| Content Applause | Post Likes / Reactions | Post Saves / Bookmarks |
| Content Amplification | Total Impressions | Post Shares / Retweets |
| Audience Interaction | Generic Comments ("Nice!") | Detailed Comments / Questions |
| Website Traffic | Total Clicks | Click-Through Rate (CTR) / Conversions |
Focusing on the "High Signal" column is what separates busy work from effective strategy. Those are the numbers that correlate with actual business results.
For us, a single, detailed comment from a potential customer in a niche subreddit is infinitely more valuable than a thousand passive followers. That one comment is a direct line to product feedback, a potential case study, and a future advocate.
This obsession with high-quality interaction is the bedrock of our entire approach. Strong engagement is a powerful early sign of a healthy community and a great indicator of product-market fit. It’s the foundation for every other metric we’re about to cover, showing you how to measure what really moves the needle for your startup.
The Four Pillars of Meaningful Engagement
If you're staring at a spreadsheet full of social media data, it’s easy to get lost. All those numbers—likes, shares, comments—can feel overwhelming and, frankly, a bit meaningless without a clear framework to make sense of them.
At BillyBuzz, we cut through the noise by filtering every metric through what we call the Four Pillars. This isn't just theory; it's the practical model we use to diagnose our content's performance and figure out what's really working.
Think of it as a journey. A user can't share your message until they've talked about it. They can't talk about it until they've given it a nod of approval. And they can't approve of what they've never seen. This simple hierarchy shows you exactly where your strategy is hitting a wall.
Here’s a visual breakdown of how we separate the high-impact metrics from the vanity ones.
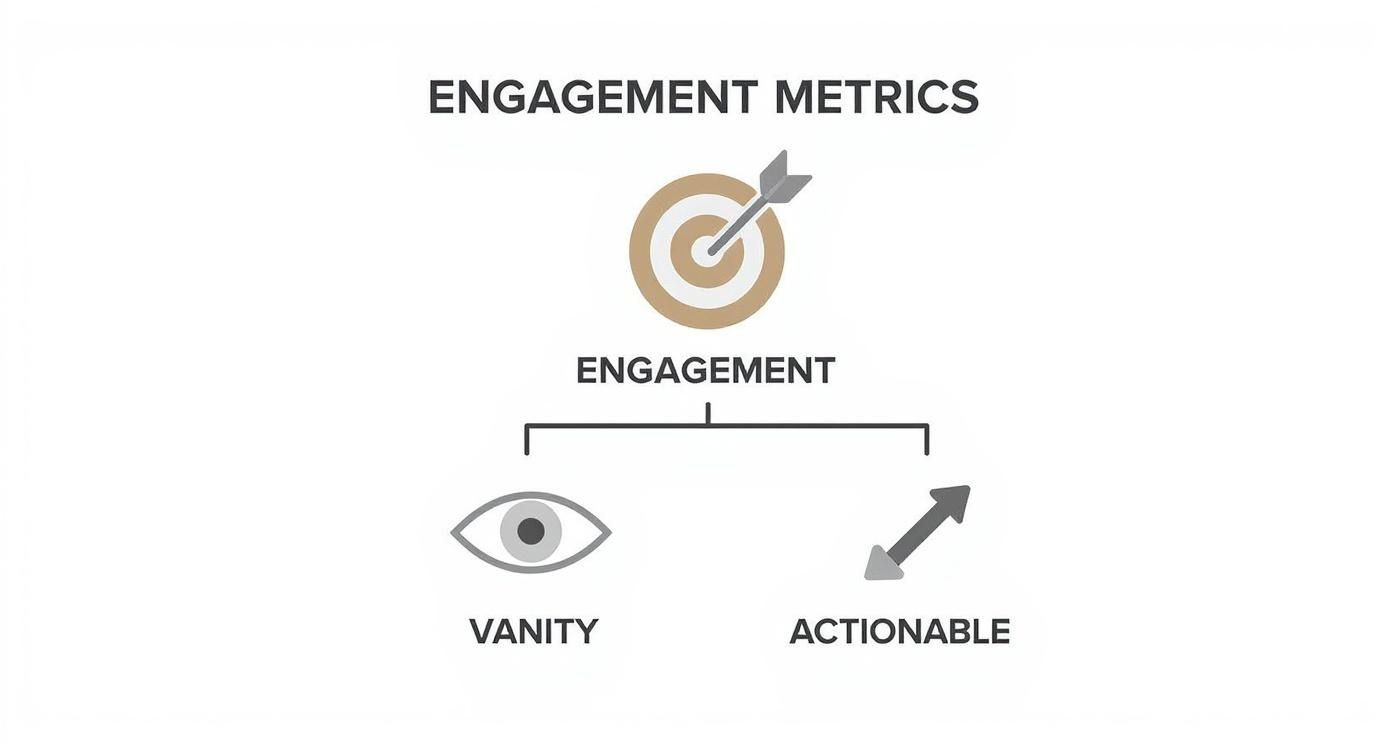
The big takeaway here is that true, meaningful engagement is the bullseye you're aiming for, and it’s built on the foundation of all the other metrics combined.
Pillar 1: Attention
First up, you need Attention. This is the absolute ground floor, covering basic metrics like Reach (how many unique people saw your post) and Impressions (how many total times it was displayed).
All this tells you is whether people even had a chance to see your content. It’s the very top of your engagement funnel.
If you have sky-high impressions but crickets everywhere else, that’s a huge red flag. It means the algorithm put your post in front of people, but your message, your visual, or your hook just didn't connect, and they kept on scrolling.
Pillar 2: Validation
Next comes Validation. Think of these as your likes, reactions, and saves. A like is a simple head nod from the audience—a quick, low-effort signal that they saw and appreciated what you posted.
A Save, on the other hand, is a much stronger signal. It means your content was so valuable that someone tucked it away to revisit later. That’s a good sign.
These are the passive but essential engagement metrics social media teams track to confirm their content isn't just shouting into the void. They tell you you’re on the right track, but they don't mean you've sparked a real dialogue… yet.
Pillar 3: Conversation
This is where things get interesting. The third pillar is Conversation, and it’s where community is born. We’re talking about Comments, replies, and even direct messages.
A comment takes way more effort than a simple like. It shows someone was genuinely moved—or even provoked—enough to stop and type out their own thoughts.
Honestly, this is where we spend most of our energy at BillyBuzz. A post with massive reach but zero comments is a failure in our book. It means we broadcasted a message but completely failed to start a discussion, which is the entire point of being "social."
Pillar 4: Amplification
Finally, we arrive at the holy grail: Amplification. This is the ultimate goal, captured by metrics like Shares and retweets.
When someone shares your content, they’re doing more than just passing it along. They are putting their own reputation on the line to vouch for your message with their personal network. It's the strongest signal that you’ve created something truly valuable.
Amplification isn't just engagement; it's earned trust. For more hands-on advice, take a look at our guide on creating an effective social media engagement checklist.
Our Internal Playbook for Tracking Engagement
Theory is one thing; execution is everything. Let's pull back the curtain on how we track engagement metrics on social media at BillyBuzz. This is our operational system for finding conversations that move the needle.
The social media universe is massive. As of October 2025, there are roughly 5.66 billion users worldwide, which creates an almost overwhelming number of places to connect. For a deep dive into these numbers, check out the latest from DataReportal on social media users. Instead of shouting into the void, we focus where our ideal customers—founders and marketers—are already asking questions our product solves.
We’ve moved beyond listening; we actively participate in the right communities at the right time.

Our Automated Alert System
Missing a critical conversation is a missed opportunity. That's why we’ve set up precise alert rules inside BillyBuzz that act as our digital tripwires. These aren't just basic keyword trackers; they’re designed to separate valuable signals from noise.
Here are a few of the actual alert rules we have running 24/7:
- Competitor Mentions: We have alerts for phrases like
"[competitor name] alternative"or"how does [competitor name] work". This lets us find users deep in the evaluation process and join the conversation at the perfect moment. - Pain Point Monitoring: We actively monitor terms like
"manual Reddit tracking"or"find leads on Reddit". These are clear indicators someone is struggling with a problem we can solve. - Brand Mentions: A no-brainer. We get instant Slack notifications for any mention of "BillyBuzz" so we can jump on feedback or answer questions right away.
Authentic Reddit Engagement
For us, Reddit is the main event. It's where you find unfiltered, in-depth conversations you don't see anywhere else. Our strategy is built on adding value, not dropping links. We listen more than we talk and always aim to offer genuine help.
We treat Reddit less like a lead-gen channel and more like a massive, always-on focus group. Insights from subreddits like
r/SaaSandr/startupsdirectly impact our product roadmap.
To show you how this works, here's a small part of our actual playbook for engaging on Reddit.
BillyBuzz Reddit Engagement Playbook
Here's a snapshot of the specific subreddits, post types, and response templates we use for targeted, helpful engagement.
| Target Subreddit | Typical Post Type | Our Response Goal | Example Response Snippet |
|---|---|---|---|
r/marketing |
"How do you measure social media success?" | Provide a useful framework, not a sales pitch. | "Great question! We start by separating vanity metrics from action metrics. For us, Engagement Rate per Impression tells a truer story than just likes..." |
r/SaaS |
"Best tools for community building?" | Share our own experiences and tools first, mentioning ours only if it's a natural fit. | "We've had a lot of success with a Slack/Discord combo. For finding conversations to join, we obviously built our own tool, but honestly, manual searching works if you have the time." |
r/startups |
"Struggling to find my first 10 customers." | Offer actionable advice based on what worked (and didn't work) for us. | "That's a tough spot we remember well. The thing that finally clicked for us was manually finding 20 people on Reddit who were talking about the problem and just offering to help for free..." |
This approach allows us to build relationships and credibility long before we ever ask for anything in return.
Advanced Metric Tracking
Standard engagement rates can be misleading. A post might get low engagement relative to your total follower count, but what if it had really high engagement among the small group of people it actually reached? That’s why we’re obsessed with a custom metric: Engagement Rate per Impression.
This simple tweak tells us how compelling a piece of content really is, regardless of the algorithm's mood that day. By focusing on impressions, we get a much cleaner signal on content quality. It’s a core part of building a smarter approach to social analytics. You can read more about how this works in our deep-dive on how AI measures social media engagement.
How to Calculate Your True Engagement Rate
https://www.youtube.com/embed/bUCBZJmUEh4
Let's get one thing straight: not all engagement rate formulas are the same. Too many marketers just divide a post's likes by their follower count and call it a day. But that's a huge mistake, especially for a startup.
That old-school method completely falls apart the second a post gets traction outside your existing audience. Suddenly, a fantastic piece of content that went viral looks like a dud in your reports. We need data that tells the truth about what’s working, not numbers that just stroke our ego.
To get a real, honest look at your engagement metrics social media performance, you need to use the right formula for the right situation. Let’s break down the three main ways to do it.
The Three Core Engagement Formulas
Think of these formulas as different lenses to view your content's performance. Each one tells you something unique, and knowing when to use each is what separates the pros from the rookies.
- Engagement Rate by Reach (ERR): This is the gold standard for measuring how compelling a single post is. It answers a simple question: Of the people who actually saw this post, what percentage cared enough to interact? It’s our go-to for figuring out if our creative is hitting the mark.
- Engagement Rate by Impressions (ER Imp): This one is particularly handy for paid campaigns. Impressions count every single time your ad is shown, even if it's to the same person multiple times. A high ER Imp tells you your ad is sticky—it’s good enough to catch someone's attention repeatedly.
- Engagement Rate by Followers (ERF): This is the classic formula, but it's also the most flawed. It measures engagement against your total follower count. While it can give you a baseline for how your loyal followers are responding over time, it becomes almost meaningless when a post reaches a wider audience.
At BillyBuzz, we live and die by Engagement Rate by Reach for our organic stuff. It cuts through the noise of algorithm changes and follower counts to give us a pure signal on whether or not our content actually resonated with the humans who saw it.
Putting the Formulas into Practice
To show you how wildly different the story can be, let's run the numbers on a real post we shared a while back.
The Post's Stats:
- Total Engagements (Likes + Comments + Shares): 350
- Unique People Reached: 5,000
- Total Impressions: 7,500
- Our Follower Count: 10,000
Ready? Let's plug those numbers into our three formulas.
- By Reach (ERR): (350 Engagements / 5,000 Reach) x 100 = 7%
- By Impressions (ER Imp): (350 Engagements / 7,500 Impressions) x 100 = 4.6%
- By Followers (ERF): (350 Engagements / 10,000 Followers) x 100 = 3.5%
Look at that spread! A 7% engagement rate is fantastic—it tells us this post was a certified hit with the audience who saw it. But a 3.5% rate is just... fine. By choosing the right formula, you go from reporting an "average" post to proving you created something truly valuable. That's how you defend your strategy with data that matters.
Alright, let's get those social media numbers in perspective. You're tracking your metrics, which is great, but now you're probably asking the same question every founder does: what does ‘good’ actually look like?
Without context, your numbers are just noise floating in the digital ether. Chasing some generic, industry-wide engagement rate can be just as pointless as buying followers.
Think about it. A B2B SaaS company crushing it on LinkedIn is playing a completely different game than a direct-to-consumer fashion brand going viral on TikTok. Trying to compare the two is a recipe for a headache and a whole lot of frustration. The only benchmark that truly matters when you're starting out is your own.
Start by Competing Against Yourself
Before you even glance at an industry report, look inward. Your first and most important goal isn't to beat some random company in a totally different space; it's to beat your performance from last month. This mindset creates a powerful cycle of real, achievable improvement.
Here at BillyBuzz, we keep our process simple but disciplined. We don’t just set a goal and hope for the best. We’re constantly tweaking our targets every quarter based on two critical factors: our own performance trends and any big algorithm shifts the platforms throw at us.
For example, when we noticed LinkedIn’s algorithm started favoring comments over shares, we didn't just keep doing the same old thing. We pivoted our content strategy to spark more direct discussions in the comments, making that metric a much more important KPI for that quarter.
B2B SaaS Industry Baselines
While your own data is king, it's still useful to know the general lay of the land. For B2B SaaS startups like us, here are some realistic starting points for the platforms that matter most:
- LinkedIn: You should be aiming for an engagement rate between 2-5%. If you’re hitting anything higher, you’ve really struck a chord with your professional audience.
- X (formerly Twitter): The bar is a bit lower here, with a good engagement rate hovering around 0.5-1%. The feed moves so fast that you have to be consistently delivering value just to get noticed.
The real win isn't just hitting an arbitrary number. It’s about digging into the why behind your top-performing posts. Was it the format? The topic? The time you posted? That's the goldmine of data that will actually fuel your growth.
This landscape is also a moving target. The engagement metrics social media teams track are always evolving. Just look at the 2023 launch of Threads, which exploded onto the scene and showed a massive user appetite for conversation-first apps. This trend, along with the continued growth of communities on Reddit and Telegram, tells us people want genuine discussion, not just passive scrolling.
You can dive deeper into these digital trends at WeAreSocial. This is exactly why we’re always adapting our goals at BillyBuzz—to make sure our targets reflect how people are actually using social media right now.
Turning High Engagement Into Tangible Business Growth
It's easy to get excited about a post that gets a lot of likes and comments. But let's be honest—vanity metrics don't pay the bills. The real measure of success is whether all that social media buzz translates into actual growth: sign-ups, qualified leads, and real revenue.
At BillyBuzz, we see strong engagement not as the finish line, but as the starting gun for our growth engine.
Every comment thread packed with thoughtful replies is a goldmine. We personally dive into these conversations to find potential product champions. Think about it: a user who leaves detailed feedback or asks smart, challenging questions isn't just "engaged." They're a perfect candidate for a beta program or a customer interview.

These back-and-forths are more than just friendly chats. They’re raw, unfiltered insights into customer pain points. We take this feedback and plug it directly into our product roadmap, making sure we’re building what our audience is literally asking for.
Amplifying Your Winners With Paid Ads
When we find a piece of organic content that really connects—a post with an off-the-charts Engagement Rate by Reach—we don’t just pat ourselves on the back. We put money behind it. Turning a proven organic winner into a paid ad is one of the smartest, most efficient ways to scale your message.
This isn’t just a hunch; it’s a core marketing strategy backed by data. In 2023, social media ad spending in the U.S. alone hit $72.3 billion. A staggering 86% of marketers say their top benefit was increased exposure. The numbers, which you can dig into on Statista, confirm that boosting content already proven to resonate is a safe bet.
Engagement isn't just a social media KPI; it’s a powerful business intelligence tool for your entire growth engine. It tells you who to talk to, what to build next, and which messages are worth putting money behind.
This approach stops social media from being just another marketing channel. Instead, it becomes a direct feedback loop that fuels everything from product development to lead generation.
We break this down even further in our guide on measuring social media ROI and conducting a cost-benefit analysis. It’s all about connecting the dots from a simple comment all the way to a paying customer.
Your Top Questions About Engagement Metrics, Answered
Let's be honest—digging into social media metrics can sometimes feel like you're trying to hit a moving target. We get these questions all the time from other founders, so here are the straight-up, no-nonsense answers you need.
Which Engagement Metric Matters Most?
If you forced us to choose just one, it would be the Engagement Rate by Reach (ERR). Why? Because it cuts through the noise. This metric tells you the percentage of people who actually saw your post and were inspired enough to do something about it.
It's the cleanest signal you have for judging content quality, without getting sidetracked by fluctuating algorithms or your total follower count.
How Often Should I Be Checking My Metrics?
It's tempting to refresh your dashboard every five minutes, but that's a recipe for madness. Resist the urge to obsess over daily spikes and dips.
We recommend a quick weekly check-in to catch any immediate trends. Then, set aside time for a more thorough monthly review to see what’s working and what isn’t, which will help shape your upcoming content. Quarterly reviews are perfect for making those bigger-picture decisions, like adjusting your content strategy or deciding which platforms deserve more of your time.
Here at BillyBuzz, we live by a simple rule: never make a major strategy change based on a single post's performance. One viral hit or a surprising flop is just a data point, not a trend. Always look for the patterns that emerge over time.
What’s a Good Engagement Rate for a B2B Startup?
This definitely changes depending on where you're posting, but here are some solid benchmarks to aim for:
- LinkedIn: Shooting for 2-5% is a great goal. The audience here is dialed in and professional, so high-value content tends to get the attention it deserves.
- X (formerly Twitter): The feed is fast and furious, making engagement a bit tougher to capture. A rate between 0.5-1% is a solid sign you're on the right track.
For even more insights and answers, you can explore frequently asked questions on social media engagement.
Stop guessing and start engaging. With BillyBuzz, you can automatically find and join the conversations that matter on Reddit, turning high-quality engagement into real leads. Discover how BillyBuzz works.