

As a founder, you're told to be on social media. But no one shows you how to prove it’s actually working. To measure social media, you have to stop tracking likes and follower counts and start focusing on what impacts the business.
This means connecting every post and comment to a real-world outcome, whether that's generating leads or keeping customers happy. It's not about being popular; it's about being profitable.
Stop Chasing Vanity Metrics
For far too long, social media success was just a numbers game. How many followers? How many likes? At BillyBuzz, we fell right into that trap. I remember celebrating 10,000 followers, but if you’d asked me how that milestone affected our bottom line, I would have drawn a blank.
That was an expensive lesson in chasing what we now call vanity metrics.
The breakthrough came when we stopped asking, "How popular are we?" and started asking, "How is this activity helping us grow?" That shift is the foundation of a real measurement strategy. You stop just "posting" and start investing your time with a clear purpose.
From Noise to Signal
Think of vanity metrics as noise. They're loud and make you feel like something is happening, but they don't tell you much. Actionable metrics, on the other hand, are the signal. They're quieter, but they carry the information you need to make decisions.
For instance, a high follower count is just noise. But a 15% increase in demo requests from a targeted LinkedIn campaign? That’s a crystal-clear signal.
This infographic breaks down how to move from surface-level data to the metrics that truly drive business growth.
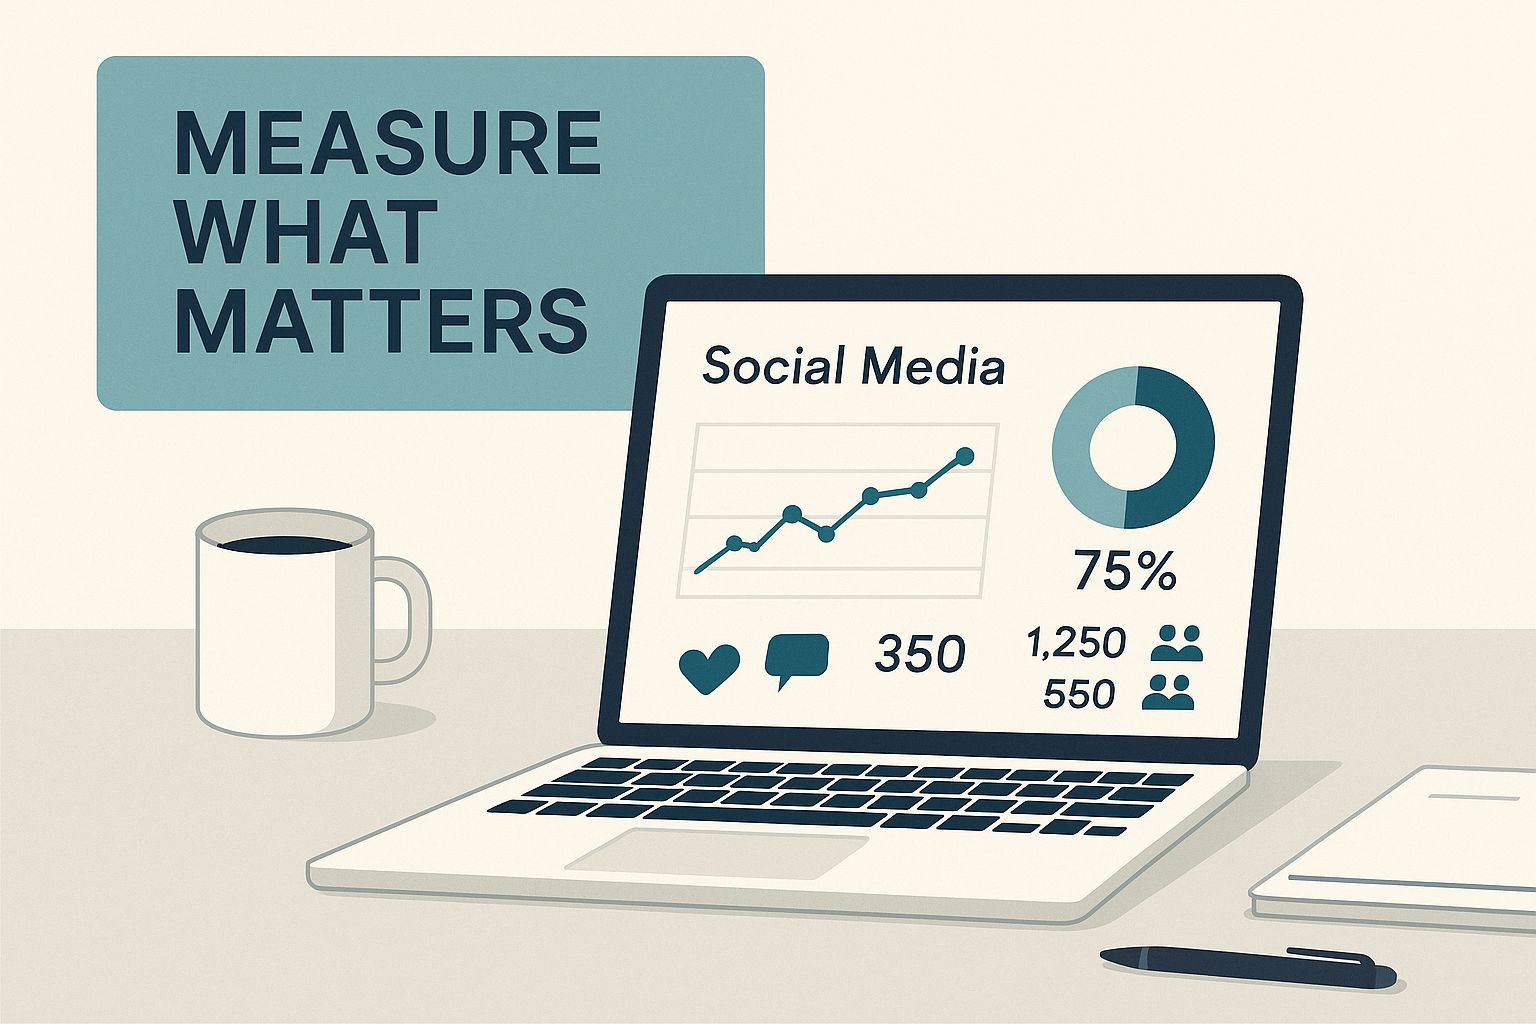
Real measurement starts with a business goal. From there, you work backward to identify the social media activities that will help you achieve it.
At BillyBuzz, our goal isn't just to be present; it's to be profitable. We don't measure success by follower growth. We track the number of qualified leads our social listening activities generate on platforms like Reddit. Every action is scrutinized through the lens of ROI.
The most dangerous thing a founder can do is confuse activity with progress. Measuring social media correctly ensures your social media activity is progress.
This approach transforms social media from a marketing expense into a predictable investment. It gives you the power to justify your budget, fine-tune your strategy, and prove your efforts are contributing to growth.
Here's a quick reference table showing how to align business goals with the social media metrics that actually measure progress.
Connecting Business Goals to Social Media KPIs
| Business Goal | Primary Social Media KPI | Example Measurement |
|---|---|---|
| Increase Brand Awareness | Reach and Impressions | Track the total number of unique users who saw your content month-over-month. |
| Generate Leads | Conversion Rate | Measure the percentage of users who clicked a link in a post and completed a form. |
| Drive Website Traffic | Click-Through Rate (CTR) | Analyze the number of clicks on your post links divided by the number of impressions. |
| Improve Customer Loyalty | Engagement Rate | Monitor likes, comments, shares, and saves on posts from returning customers. |
| Boost Sales | Social Media ROI | Calculate the revenue generated from a campaign versus the cost of running it. |
Using a framework like this ensures every metric you track is tied to an outcome that matters. It’s the difference between being busy on social media and being effective.
The Three Tiers of Social media Measurement
To measure social media effectively, you need a solid framework that connects what you're doing on social platforms to your bottom line. At BillyBuzz, we think in tiers—like a pyramid, where each level supports the one above it.
This layered approach helps you see the whole story, not just a single chapter. It stops you from getting distracted by flashy "vanity metrics" and points you toward the numbers that actually signal business growth.
Tier 1: Awareness and Reach
This is the base of your pyramid. The question here is: How many people are we reaching? Before anyone can buy your product, they first have to know you exist.
The core metrics are Reach (how many unique people see your content) and Impressions (how many times your content was displayed). If we post about a new feature and see a massive reach, we know our distribution is working.
We also watch our Social Share of Voice (SSoV). This tells us how much of the conversation in our industry is about us versus our competitors. It’s a great way to check our brand’s relevance in the market.
Tier 2: Engagement and Community
So, people have seen your content. Do they care? This is where we move from passive views to active participation. Engagement is the clearest sign that your content is hitting home, turning random viewers into a community.
Here, we're measuring the stuff that signals genuine interest:
- Engagement Rate: We look at likes, comments, shares, and saves in relation to our reach. A post with thoughtful comments is way more valuable than one with thousands of mindless likes.
- Audience Growth Rate: Instead of just tracking total followers, we monitor our month-over-month percentage growth. This tells us if we’re consistently attracting interested people.
- Sentiment Analysis: We use our own tool, BillyBuzz, to see not just that people are talking about us, but how they’re talking. Positive sentiment is a huge indicator of strong brand health.
At BillyBuzz, we treat every comment like a golden opportunity. A single high-quality comment is more valuable than a hundred likes because it opens the door to a real conversation. That's where relationships—and future sales—are built.
Tier 3: Conversion and ROI
This is the top of the pyramid, where your social media efforts prove their financial value. It answers the one question every founder needs to know: Is all this work actually making us money? Here, we tie social activity directly to outcomes like leads, sales, and revenue.
To get this right, we lean on metrics like Click-Through Rate (CTR) and Conversion Rate. We are religious about using UTM parameters on every link we share. This lets us track exactly who clicks through to our website and then signs up for a demo or starts a trial.
The potential here is staggering. By 2025, there will be an estimated 5.45 billion people on social media, spending around 2 hours and 24 minutes there every day. With 25.9% of users actively searching for products to buy, the opportunity to drive real business is massive. You can find more of these game-changing numbers in this report on social media statistics from sonary.com.
This three-tiered approach gives you the full picture. Awareness fills the funnel, engagement nurtures your audience, and conversion metrics prove the tangible return on your investment. When you measure social media this way, you stop guessing and start knowing, turning your social channels into a reliable engine for growth.
Our Social Listening Playbook (Inside BillyBuzz)
To understand what's happening, you can't just count likes on your own posts. You have to tune into the conversations happening about you, your competition, and the industry.
At BillyBuzz, we don't have a huge team, so we built a lean, automated social listening system. This isn't just theory—it's the exact playbook we use every day. Our system is built on one idea: find the right conversations and get there first. We use tools like Brand24 to set up real-time alerts that cut through the noise, delivering only the opportunities that matter.
Our Exact Keyword Alerts
The core of our system is a handful of specific keyword alerts. We don't just track "BillyBuzz." We monitor a spectrum of terms to get a 360-degree view of our market.
Here’s a look at how we structure our alerts inside our social listening tool. It's designed to filter conversations by intent, so we know how to engage.
| Alert Category | Keyword/Filter Example | Monitored Source | Actionable Goal |
|---|---|---|---|
| Brand Mentions | billybuzz, billybuzz.com |
All Social Media, News | Engage users, track sentiment, manage reputation. |
| Competitor Tracking | "alternative to Competitor A", "Competitor B review" |
Reddit, X (Twitter) | Identify competitor weaknesses and find users looking for a new solution. |
| Problem & Pain Points | "how to track Reddit leads", "social listening for startups" |
Reddit, Quora | Find potential customers actively seeking a solution we provide. |
This setup ensures we're listening for opportunities, not just our name. Tracking phrases like "alternative to Competitor B" is one of our best sources for high-intent leads. It’s a giveaway that someone is actively shopping for a new tool. For a deeper look, check out our guide on social listening for B2B lead generation.
Our Subreddit Hotlist
Reddit is our goldmine for unfiltered customer feedback. Founders and marketers in certain subreddits are incredibly honest about their problems. We manually check a curated list of communities where our ideal customers spend time.
Our primary targets include:
- r/saas: For conversations around SaaS growth, metrics, and challenges.
- r/startups: To find early-stage founders talking about their first growth hurdles.
- r/marketing: A broader community where we spot trends and see what tools people recommend.
Here’s the kind of high-value conversation we find all the time in a subreddit like r/saas.
Threads like this are pure gold. They're packed with insights into customer needs, gaps in the market, and the exact words people use to describe their problems.
Our Go-To Response Templates
When you find a conversation, speed matters. We’ve developed a few simple response templates so we can reply quickly while still sounding human. We always personalize them before hitting send.
Our Golden Rule: Always add value before you ask for anything. A genuinely helpful answer builds more trust than a link to your pricing page.
For a positive mention of BillyBuzz:
"Hey [Username], so glad to hear you're finding [Feature] useful! Thanks for the shout-out. We're actually working on an update for that—would love to get your feedback on it when it's ready."
For someone asking for a tool recommendation we fit:
"Hey [Username], for tracking conversations on Reddit, we built BillyBuzz to solve this exact problem. It uses alerts to find high-intent mentions so you can jump in first. Might be worth a look. Happy to answer any questions."
This internal system is how we measure social media beyond vanity metrics. It turns online chatter into an active, measurable source of market intelligence, customer feedback, and qualified leads.
Calculating Social Media ROI to Prove Its Value

Let's get straight to the point. Return on Investment (ROI) is the ultimate metric. It’s the final boss in social media measurement, answering the one question every founder truly cares about: “Is all this effort actually worth our time and money?”
At BillyBuzz, we got tired of shrugging our shoulders. We developed a dead-simple formula that shifts the conversation from "we got 100 likes" to "we generated $5,000 in pipeline value."
The Simple ROI Formula We Use
You can forget about convoluted spreadsheets. At its heart, the calculation is surprisingly straightforward. It just compares what you gained to what you spent.
(Value Generated - Total Investment) / Total Investment * 100 = Social Media ROI %
The magic isn't in the math; it’s in how you define “Value” and “Investment.” This is where most people get tripped up.
To do this right, especially for B2B founders, a solid grasp of your metrics is non-negotiable. For instance, understanding LinkedIn post analytics is critical because knowing which content actually drives clicks and conversions is the first step in assigning a real dollar value to your activities.
Defining Your Social Media Investment
Your investment is more than just ad budget. To get an honest number, you have to account for every resource. Here at BillyBuzz, we track two main costs:
- Direct Ad Spend: The actual cash you spend on boosting posts or running campaigns.
- Time Invested (The Founder Cost): Your time is your most precious asset. We assign an hourly rate to all time spent creating content, replying to comments, and managing the campaign. Even if it’s “just” your own time, it has a cost.
Forgetting to include the cost of your time is the single biggest mistake founders make. An "organic" campaign isn't free if it took you 10 hours to pull off.
Assigning Monetary Value to Conversions
This is where the game is won. You have to assign a specific dollar value to every action a user takes. This is how you transform "engagement" into pipeline value.
Here's a look at our internal value ladder:
| Conversion Action | Assigned Value | Why This Value? |
|---|---|---|
| Newsletter Signup | $10 | Based on the historical lead-to-customer conversion rate from our email list. |
| Gated Content Download | $25 | These users show higher intent by trading their email for valuable content. |
| Demo Request | $250 | This is a high-intent, sales-ready lead, representing significant potential revenue. |
These numbers aren't pulled out of thin air. We got them by working backward from our average customer lifetime value (LTV). By figuring out how different actions correlate with eventual sales, we can confidently assign a dollar amount to each step. For an even deeper dive, check out our article on a cost-benefit analysis for measuring social media ROI.
Platforms like Facebook are central to this, especially with the rise of social commerce. It's still the largest social network, with over 3.065 billion monthly active users. More importantly, 39% of its users make purchases directly through the platform, which proves its immense power to drive measurable sales.
When you start using this framework, you can finally put a real number on your efforts. You can walk into a meeting and say, "Our last X (Twitter) campaign generated a 150% ROI," instead of showing off a chart of likes. This is how you measure social media like a business owner, not a marketer.
Building Your First Social Media Measurement Dashboard
Jumping into social media measurement can feel like drinking from a firehose. So much data, so many tools. What if I told you that you don't need a fancy platform to get started?
Here at BillyBuzz, our first "dashboard" was a Google Sheet. It was one of the most powerful things we built because it forced us to be ruthless about focusing only on the metrics that mattered.
The goal here is practicality. A dashboard is useless if it's too complicated to update or too confusing to read. We're aiming for a single, clean view that gives you a weekly snapshot of your performance.
The One-Page Dashboard Structure
A great dashboard tells a story at a glance. The best way to structure it is by following the three tiers of measurement. Imagine it as a pyramid of metrics on a single sheet.
At the top, you have the big-picture awareness numbers. As you move down, you get into engagement, and finally, you hit the metrics closest to the money: conversions. This structure naturally follows your customer's journey, showing you the whole funnel.
Founder-to-Founder Advice: Start with a free tool like Google Sheets or a basic Looker Studio template. Get comfortable with the fundamentals there. Fancy software can come later. Right now, clarity will move your business forward.
As you start putting your dashboard together, remember that good design makes the data easier to understand. For some great tips on this, check out these 8 Dashboard Design Best Practices to make sure your layout is insightful, not just pretty.
Essential Metrics For Your Starter Dashboard
To keep things focused, your first dashboard should only pull one or two key metrics from each of the three tiers. The goal isn't to track everything; it's to track the right things. A cluttered dashboard becomes an ignored dashboard.
Here’s the bare-bones setup we recommend. You can build this in a spreadsheet in no time.
Tier 1: Awareness Metrics
- Total Reach (Week-over-Week % Change): Is your content's visibility growing?
- Audience Growth Rate: Track the percentage change in followers, not the total. This number shows momentum.
Tier 2: Engagement Metrics
- Average Engagement Rate per Post: The pulse of your community. (Total engagements / reach).
- Total Comments: Comments are conversations. A spike here means you’ve hit on a topic your audience cares about.
Tier 3: Conversion Metrics
- Website Clicks from Social: Use UTM-tagged links to see how many people jump from social to your website.
- Social Media Lead Conversions: The ultimate proof. Track how many of those clicks turn into a demo request, signup, or trial.
This simple, one-page view is all you need to start making data-informed decisions. It transforms how you measure social media from a chore into a strategic advantage. To see how we apply this same thinking to more complex setups, you can explore our guide on creating custom dashboards for social media monitoring.
Common Measurement Mistakes We Learned the Hard Way
We've made just about every mistake you can, so you don't have to. When you first start trying to measure social media, it's incredibly easy to get bogged down by the wrong things. This isn’t a theoretical list—these are the actual potholes we hit at BillyBuzz.
Treating Platforms Like Separate Islands
Early on, we treated each platform as its own kingdom. We’d pull a report on LinkedIn’s growth, then X’s, then Reddit’s. The problem was we never connected the dots.
A real person might see our post on LinkedIn, hop over to X to ask a question, and finally buy after reading a helpful Reddit thread. By measuring in silos, we were blind to the customer journey. The fix was simple: we started using UTM parameters for everything and piped all our data into a single dashboard. Suddenly, we could see how all the channels worked together.
Ignoring the Gold in Your DMs
For the first year, our measurement was all about numbers. We were obsessed with reach and engagement rates. We completely overlooked the qualitative goldmine in our comments and direct messages. We were so focused on the what that we forgot to ask why.
This hit home after we launched a new feature. The metrics looked okay, but a single DM from a frustrated user pointed out a critical flaw our spreadsheets never would have caught. Now, every week, we gather the top three qualitative takeaways from our DMs and comments—what people love, what's confusing them, and what they're asking for.
Vanity metrics tell you how many people are clapping. Qualitative feedback tells you if they’re clapping for the right reasons.
This simple change reshaped our product roadmap and made our community feel heard.
The Danger of Inconsistent Tracking
In our chaotic early days, "tracking" was a loose term. We’d scramble to pull numbers right before a meeting but wouldn’t look at them again for another month. This meant we were always reacting to old news.
The solution was to bake a weekly metrics check-in into our team's DNA. It's non-negotiable. Every Monday morning, our dashboard refreshes, and we spend 15 minutes as a team looking at the week-over-week changes. This steady rhythm is what allows us to be nimble and make small course corrections before they become big problems.
With the online world constantly growing, consistency is everything. By mid-2025, data showed a staggering 5.41 billion social media users, with 241 million new people joining in just one year. You can dig into more of these numbers about the massive scale of social media identities on datareportal.com. Without a regular measurement habit, you’re just flying blind.
Your Top Social Media Measurement Questions, Answered
We get asked about measuring social media all the time by other founders. Here are our straight-to-the-point answers to the most common questions.
What’s the Single Most Important Social Media Metric?
There isn’t one. The "most important" metric is always the one that ties directly back to what you're trying to achieve right now.
- Building brand awareness? Reach and Impressions are your best friends.
- Need to generate leads? Your north star is Conversion Rate from social.
- Focused on community? Engagement Rate and the number of meaningful comments blow everything else out of the water.
Start with the business goal, not the metric. The right metric will naturally follow.
How Often Should We Be Looking at This Stuff?
It's easy to get buried in data, so at BillyBuzz, we run a two-track system.
We glance at our core KPIs—like conversions from social and overall engagement—on a weekly basis. This is our pulse check. It’s a quick look to spot anything weird or wonderful.
Then, we do a much deeper dive monthly or quarterly. This is where we step back and analyze the big picture: what's working with our strategy, what’s the actual ROI, and are we seeing long-term growth? This rhythm keeps us agile without getting lost in the weeds.
Consistent, quick check-ins are far more valuable than massive, infrequent reports. A 15-minute review every Monday beats a 3-hour deep dive once a quarter, every time.
Is It Possible to Measure Social Media Without Fancy Paid Tools?
Absolutely. When we were first getting started, we didn't have a budget for expensive software, so we relied on what was freely available.
Every major platform has its own native analytics dashboard. Tools like Meta Business Suite or LinkedIn Analytics are surprisingly powerful and give you great data on reach, engagement, and who your audience is.
You can create a solid starter dashboard just by exporting that data into a simple spreadsheet. Don't let a tight budget be the reason you fly blind.
Ready to stop guessing and find high-intent leads on Reddit? BillyBuzz uses AI to monitor relevant conversations and alerts you the moment a potential customer needs help. You can jump into the discussion and drive real growth. Discover your next customer at https://www.billybuzz.com.