
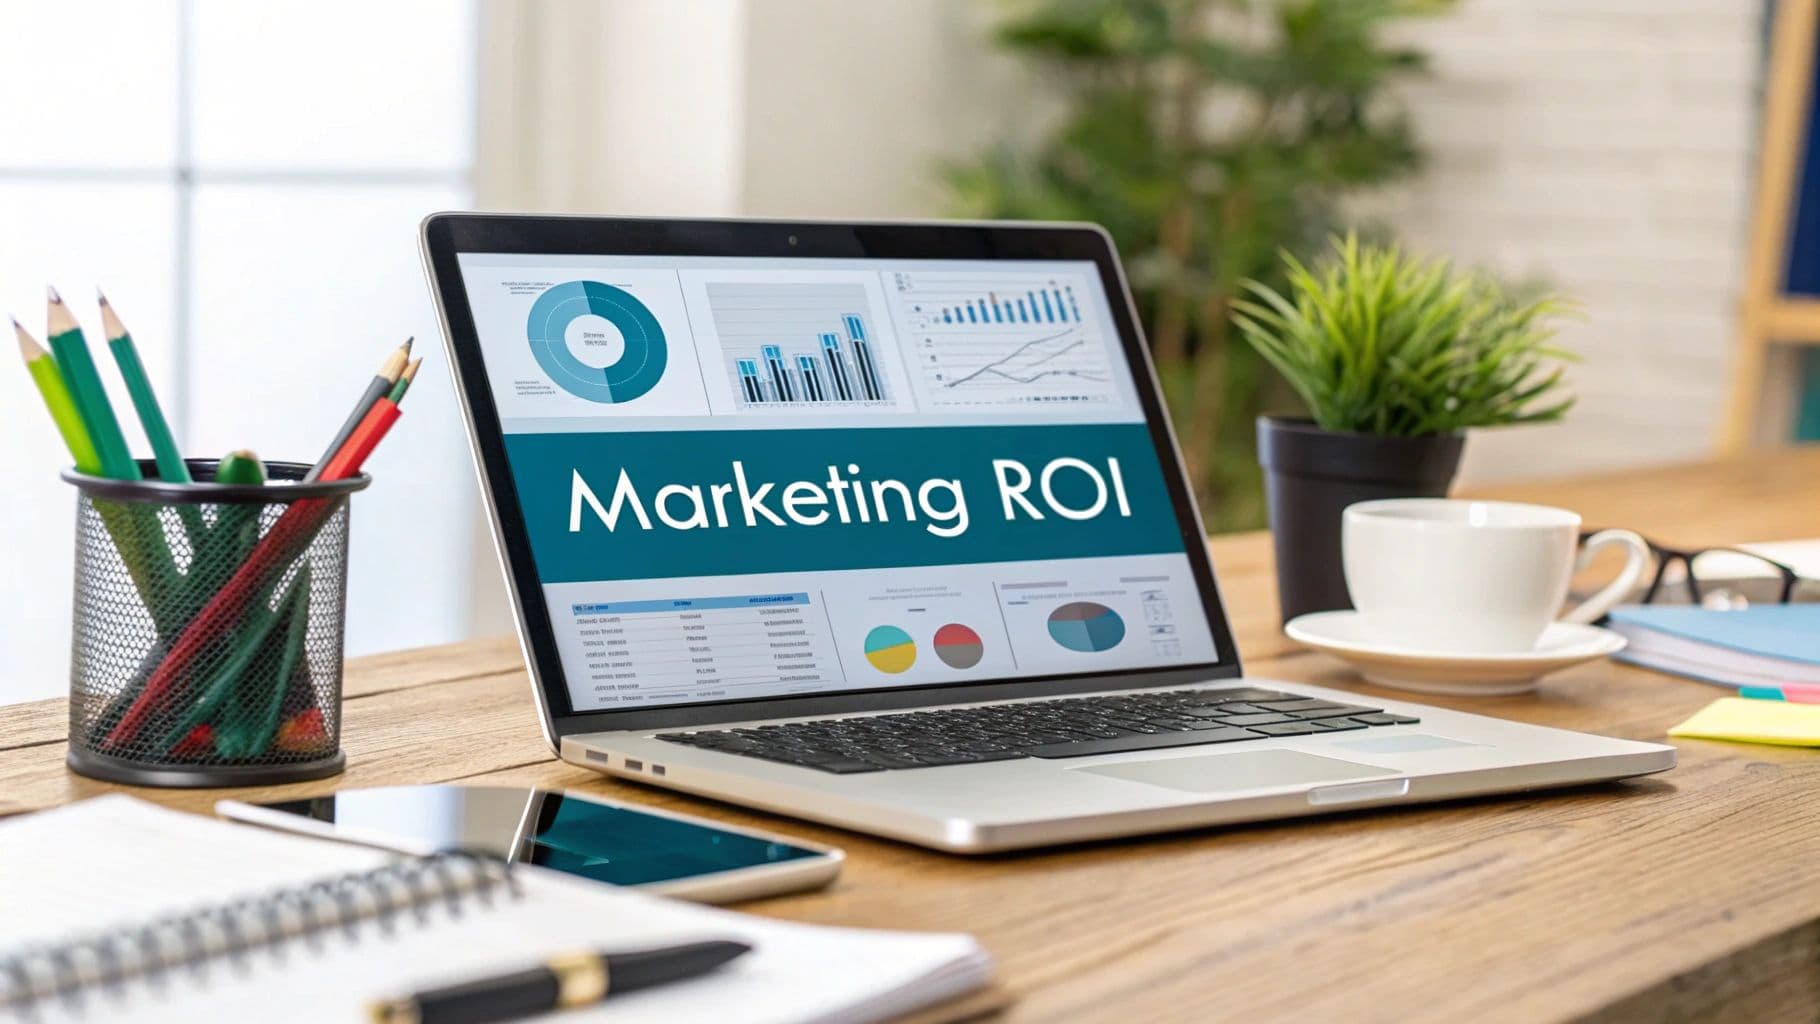
Measuring marketing effectiveness isn't just about tracking clicks and impressions. It’s about drawing a straight line from every dollar you spend to a real business result—think qualified leads, new sales, and long-term customer value. This means getting past the vanity metrics and focusing on what actually moves the needle.
Moving Beyond Guesswork in Your Marketing
Let's be real for a second. Most guides on this topic feel like they were written for a marketing textbook, not for a founder who needs to make payroll. At BillyBuzz, we don't have time for theory. We need to know what's working and what's a waste of money, and we need to know it now. This is our no-fluff, founder-to-founder guide on measuring what actually matters.
We live by a simple rule: if we can't tie a marketing activity back to a core business goal, we don't do it. This isn't just a catchy phrase; it's a survival tactic. It forces us to be crystal clear about our objectives and stops us from chasing the latest shiny object that won't impact our bottom line. For a deeper dive into this philosophy, check out this modern guide to measuring campaign success.
Our Core Marketing Framework
To put this into practice, we map every single channel directly to a business goal and a primary Key Performance Indicator (KPI). This gives us a direct line of sight from our effort to the actual outcome. We deliberately avoid getting bogged down by dozens of secondary metrics by focusing on the one KPI that truly signals success for that specific goal.
Here’s a look at the exact framework we use internally.
Our Core Marketing Measurement Framework
This table shows how we align marketing channels with business goals and the primary KPIs we use to measure success at each stage.
| Business Goal | Example Marketing Channel | Primary KPI | Measurement Tool We Use |
|---|---|---|---|
| Generate Qualified Leads | Targeted Reddit Monitoring | Marketing Qualified Leads (MQLs) | Our Internal BillyBuzz Dashboard + CRM |
| Increase Product Signups | Paid Social Ads (LinkedIn) | Cost Per Acquisition (CPA) | LinkedIn Ads Manager + Google Analytics 4 |
| Drive Organic Traffic | SEO & Content Marketing | Organic Keyword Rankings for "Money" Terms | Ahrefs |
| Nurture & Convert Leads | Email Marketing Automation | Lead-to-Customer Conversion Rate | HubSpot |
This framework isn't set in stone. We revisit it every quarter to make sure our channels and KPIs still line up with where the business is headed. The real beauty of it is its simplicity. Anyone on our team, from marketing to product, can glance at this and immediately understand how we define a "win."
The goal isn't just to measure marketing; it's to create a shared understanding of what "effective" means for your specific business. When your whole team is aligned on the KPIs that matter, decision-making becomes faster and more accurate.
This whole approach is designed to cut through the noise. Instead of getting into debates about impressions or click-through rates, our conversations are grounded in what actually drives growth. It lets us spot underperforming channels quickly and shift our budget to the ones that are delivering real, measurable value. It’s not just about tracking numbers—it's about building a system for predictable growth.
Building Your Lean Measurement Tech Stack
Your insights are only as good as the data you collect. A messy, disconnected set of tools will lead you straight to confusion and bad decisions. On the flip side, expensive enterprise software is often overkill for most founders. At BillyBuzz, we run on a lean but powerful tech stack that gives us a unified view of the customer journey without the bloat.
The secret isn’t a single magic tool; it's the disciplined connection between a few core platforms. For us, that means three key components working in harmony:
- Google Analytics 4 (GA4): This is our source of truth for all web behavior. It’s where we see how users find us, what they do on our site, and where they drop off.
- Our CRM (HubSpot): This is where lead and sales data lives. It tells us who our prospects are, their deal stage, and ultimately, who becomes a paying customer.
- Looker Studio (formerly Google Data Studio): This is the glue. It pulls data from GA4 and HubSpot into a single, clean dashboard that the entire team actually uses.
This simple setup prevents data silos. Our marketing team doesn't just see website traffic; they see which traffic sources are generating real sales opportunities in the CRM.

The Unskippable Step: UTM Discipline
The entire system falls apart without consistent tracking. If you can't reliably attribute a lead back to its source, you're just guessing. That's why we are absolutely ruthless about using UTM parameters for every single campaign link we create.
UTMs are just simple tags you add to a URL that tell analytics platforms where a user came from. We use a standardized format for every link, which ensures our data in GA4 is clean and easy to filter. No exceptions.
Here’s the exact structure we follow:
utm_source: Identifies the platform (e.g.,reddit,linkedin,google).utm_medium: Specifies the marketing medium (e.g.,cpc,organic_social,email).utm_campaign: Describes the specific campaign (e.g.,q4-founder-promo,feature-launch-2024).utm_content: Differentiates links within the same ad or post (e.g.,header-link,image-cta).
This consistency allows us to build dashboards that don't require manual cleanup. We can instantly see which q4-founder-promo ads are driving the most signups.
Your measurement stack is a machine. UTM parameters are the high-quality fuel it needs to run. Inconsistent or missing UTMs are like putting dirty gas in the tank—the whole thing will eventually grind to a halt.
Connecting Actions to Business Goals in GA4
Once your traffic is properly tagged, the next step is defining what a "win" actually looks like on your website. In GA4, these are called conversion events. We don't track every little button click; we focus only on actions that signal a user is moving closer to becoming a customer.
Our primary conversion goals in GA4 are pretty straightforward:
generate_lead: Fired when someone submits a demo request form.start_trial: Triggered when a user signs up for a free trial.upgrade_subscription: Our ultimate goal, configured to fire when a trial user becomes a paid customer.
By setting these up, we can directly measure how many leads our Reddit campaigns generate versus our LinkedIn ads. This moves the conversation from "how much traffic did we get?" to "how much business did this channel drive?"
Building Dashboards We Actually Use
The final piece is visualization. Raw data in GA4 or a CRM is great for deep dives, but for daily decision-making, we need a high-level overview. This is where Looker Studio comes in.
We pull data from GA4 and our CRM into a single-page dashboard that answers our most critical questions at a glance. It shows our marketing funnel, from website sessions (GA4 data) to new trials (GA4 data) to qualified leads and closed deals (CRM data), all attributed by campaign source. To effectively track your efforts and transform raw data into actionable insights, consider specialized tools for Social Media Analytics Reporting that can feed into this central dashboard.
This unified view is how we measure marketing effectiveness, spot trends, and decide where to double down.
From Vanity Metrics to Impactful Business KPIs
Look, likes and impressions are nice. They feel good. But they don't keep the lights on. The single biggest mistake I see founders make is celebrating metrics that have absolutely no connection to revenue. At BillyBuzz, we're ruthless about identifying the Key Performance Indicators (KPIs) that actually signal a healthy business.
This isn’t about just collecting data for the sake of it; it’s about drawing a straight line from a marketing action to a financial outcome. To really get beyond the vanity stuff, you have to define what actually drives growth. If you're just getting started, brushing up on the basics of common marketing metrics like CTR, CVR, LTV, and AOV is a solid first step.
The shift in mindset is simple but profound. Stop asking, "How many people saw our ad?" and start asking, "How much revenue did that ad bring in?" That change in perspective is everything.

The BillyBuzz KPI Hierarchy
To keep from getting lost in a sea of data, we organize our metrics into two simple buckets: Health Check Metrics (top-of-funnel) and Money Metrics (bottom-of-funnel). This hierarchy helps us diagnose problems quickly without all the noise.
Health Check Metrics: Think of these as leading indicators. They tell us if our campaigns are running and if anyone is seeing them. They're like the dashboard lights in your car—they don't tell you the whole story, but they'll sure alert you to an immediate problem.
- Impressions & Reach: Is our content even being seen by the right audience?
- Click-Through Rate (CTR): Is our message interesting enough to make someone click?
- Website Sessions: Are we actually driving people back to our site from our marketing channels?
Money Metrics: Now we're talking. These are the KPIs directly tied to revenue and the long-term health of the business. Honestly, this is where we spend 90% of our analysis time.
- Customer Acquisition Cost (CAC): What do we have to spend to get one new paying customer?
- Lifetime Value (LTV): How much is a customer worth to us over their entire relationship with our company?
- Lead-to-Customer Conversion Rate: What percentage of our good leads actually become customers?
- LTV to CAC Ratio: This is the ultimate health score for our business model.
This simple separation keeps the team focused. We glance at health checks daily, but our big strategic decisions? They’re driven entirely by the money metrics.
Calculating the KPIs That Actually Matter
You can't improve what you don't measure. These next three calculations are the absolute bedrock of our entire marketing analysis.
1. Customer Acquisition Cost (CAC)
This is just your total sales and marketing spend over a set period, divided by the number of new customers you brought in during that same time.
CAC = (Total Marketing Spend + Total Sales Spend) / Number of New Customers
Let's say we spend $8,000 on marketing and $2,000 on sales commissions in one month, and that effort brings in 100 new customers. Our CAC is $100. Simple. That number tells us the real, hard cost of growth.
2. Customer Lifetime Value (LTV)
This metric predicts how much revenue you can expect from a single customer over time. For a SaaS business like ours, a straightforward formula is:
LTV = (Average Revenue Per Account) / Customer Churn Rate
If our average customer pays $50/month and our monthly churn rate is 2%, then our LTV is $2,500 ($50 / 0.02).
3. The Golden Ratio: LTV to CAC
This one is the most important metric of them all. It compares how much a customer is worth to how much it cost you to get them. A healthy, sustainable business should have an LTV that is at least 3x its CAC.
Using our numbers from above:
- LTV = $2,500
- CAC = $100
- LTV:CAC Ratio = 25:1
A ratio like that tells us our business model is incredibly healthy and that we can afford to get more aggressive with our acquisition spending. On the flip side, a ratio below 1:1 means you're literally losing money with every new customer you sign.
A Real-World Example From Our Ad Spend
In the early days, our paid ads team was obsessed with one thing: lowering our Cost Per Click (CPC). They got it down to an impressively low number, but our growth was completely flat. What was the problem? We were attracting a ton of clicks, but not actual customers.
So, we shifted our entire focus to a single metric: Cost Per Qualified Lead (CPQL). Suddenly, we didn't care if a click cost $2 or $10, as long as it produced a lead who fit our ideal customer profile.
The moment we stopped optimizing for cheap clicks and started optimizing for qualified leads, our ad spend became dramatically more efficient. Our CPC went up, but our Customer Acquisition Cost plummeted because we were finally talking to the right people.
This experience highlights the danger of focusing on the wrong KPIs. It’s not just a startup problem, either. Big players find huge savings this way. Procter & Gamble famously cut $200 million from its digital ad spend by weeding out ineffective placements. JPMorgan Chase cut the number of websites their ads ran on by a staggering 99% and saw no drop in performance. Both were possible because they focused on real impact, not just raw volume.
Figuring out the return on your investment for each channel is critical, especially for something as nuanced as social media. We've actually put together a deep-dive guide on measuring social media ROI with a cost-benefit analysis that goes into more detail on this.
Choosing an Attribution Model That Makes Sense
Attribution is the messy, imperfect art of figuring out which marketing touchpoint actually gets the credit for a conversion. It’s absolutely critical for measuring marketing effectiveness, but honestly, most companies get it wrong by just sticking with the default: Last-Click attribution.
If you're only looking at the last click in a tool like Google Analytics, you're getting a dangerously skewed picture of what’s really working. This model gives 100% of the credit to the final touchpoint before a sale. It completely ignores the blog post, the social ad, or the review site that introduced the customer to you in the first place.
Think of it this way: you wouldn't give all the credit to the cashier for a sale, right? What about the window display that drew the customer in or the salesperson who helped them find what they needed? Last-Click does exactly that, and it's a huge blind spot.
This is a simplified look at how you can turn a mountain of raw data into a report that actually guides your attribution strategy.
Your analytics platform pulls all this data together, letting you visualize the customer's real path to purchase.
Our Framework for Picking the Right Model
At BillyBuzz, we don’t believe in a one-size-fits-all attribution model. We match the model to the business goal and, just as importantly, to the length of the customer journey. A short, simple sales cycle needs a completely different lens than a complex, multi-month B2B decision.
Here’s a breakdown of the models we actually use and when we deploy them:
- First-Click: We use this one for a very specific purpose: measuring the performance of our top-of-funnel, brand-awareness campaigns. It gives all the credit to the very first touchpoint, which tells us which channels are best at getting our name in front of new people.
- Linear: This is our go-to for analyzing longer, more complex sales cycles. Because it gives equal credit to every single touchpoint, it gives us a balanced view of how multiple interactions over weeks or even months contribute to nurturing a lead. It’s the most "democratic" model.
- Time-Decay: This model works incredibly well for shorter sales cycles, like a direct signup from a Reddit ad. It gives more credit to the touchpoints that happened closer to the conversion, which makes a lot of sense. It acknowledges the earlier steps but correctly weights the actions that pushed the customer over the finish line.
Most founders stick with Last-Click because it's the default. The single best action you can take to better understand your marketing is to open Google Analytics' Model Comparison Tool. Compare 'Last Interaction' to 'Linear'—you'll immediately see which channels are working harder than you thought.
From Theory to Action: A Real-World Scenario
Let's walk through a common customer journey:
- A founder sees a BillyBuzz ad on LinkedIn (First Touch).
- A week later, they search for a solution and find one of our blog posts through Google (Organic Search).
- The following week, they click a link in our email newsletter (Email).
- Finally, they see a retargeting ad on Reddit and sign up (Last Touch).
Here’s how different models would divvy up the credit:
- Last-Click gives 100% of the credit to the Reddit ad.
- First-Click gives 100% of the credit to the LinkedIn ad.
- Linear gives 25% credit to each of the four touchpoints.
- Time-Decay gives the most credit to the Reddit ad, a little less to the email, even less to the blog, and the least to that initial LinkedIn ad.
As you can see, the model you choose completely changes which channels look like winners. There’s also the Data-Driven model in GA4, which uses machine learning to assign credit. It can be incredibly powerful, but you need a good amount of conversion data before it becomes accurate. By applying a similar logic, we've refined our internal systems for understanding AI-powered relevancy scoring in digital marketing, which helps us prioritize the signals that really matter.
For us, the key is combining models. We use First-Click to validate our awareness spend, Linear to understand the entire customer journey, and Time-Decay to optimize for those final conversions. This multi-model approach gives us the nuanced view we need to measure marketing effectiveness without falling into the all-too-common Last-Click trap.
Future-Proofing Your Marketing Measurement
The ground is shifting under our feet. For years, we’ve relied on third-party cookies and user-level tracking, but that’s quickly becoming a losing game. As founders, we simply can't afford to build our growth engine on a foundation that's about to crumble.
At BillyBuzz, we’re actively future-proofing our measurement strategy. This means we're moving away from granular, user-level tracking and embracing privacy-first methods.
That’s why we’re digging into techniques like Media Mix Modeling (MMM) and incrementality testing. These aren't just for mega-corporations with huge data science teams anymore. Modern tools and frameworks have made them accessible, and frankly, they’re essential for understanding what’s actually working in a world without cookies.
Media Mix Modeling for the Rest of Us
Media Mix Modeling might sound intimidating, but the concept is actually pretty straightforward. It uses statistical analysis on aggregated data—like your weekly channel spend and total sales—to figure out how much each marketing channel contributed to the bottom line. The best part? It doesn't need to know which individual user saw which ad.
This shift isn't happening in a vacuum. EMARKETER’s 2024 data found that a whopping 61% of marketers plan to get serious about MMM, drawn in by new tools that make it far more accessible. At the same time, incrementality testing is gaining traction because it cuts straight to the core question: "What would have happened if we never ran this ad campaign?" You can read more about this trend and the future of marketing measurement.
We've started experimenting with Robyn, Meta's open-source MMM project. It’s built in R and automates much of the heavy lifting, making it a viable option even for a lean team like ours. Instead of tracking individuals, we feed Robyn our aggregated weekly data—ad spend per channel, organic traffic, total signups—and it helps us see the holistic impact.
Here's a screenshot from Robyn's official documentation showing how it visualizes the marketing spend and its predicted effect.
The charts break down your results, attributing a slice of the pie to each channel's spend. It’s a strategic, top-down view that helps us allocate our budget more effectively across channels like paid social, search, and content marketing, all without invasive tracking.
Proving Real-World Impact with Incrementality Testing
While MMM gives us that great strategic overview, we also need to answer a more tactical question: did that specific campaign actually cause more sales? This is where incrementality testing shines. It's the cleanest, most direct way to measure the true, causal impact of your marketing spend.
Our go-to method is the geo-based holdout test. It sounds complex, but it's simpler than you think.
Here’s our playbook for running one:
- Define Control and Test Groups: We select a set of similar geographic regions (like states or major cities). Then, we randomly assign some to the "test" group, which will see the ads, and the rest to the "control" or "holdout" group, which won't.
- Run the Campaign: We launch the ad campaign, but only target the test regions. The control group gets nothing.
- Measure the Lift: After the campaign, we compare the sales or signup data between the two groups. The difference in performance is the incremental lift—the real-world impact of the campaign.
Running a holdout test answers the single most important question in marketing: "Would these sales have happened anyway?" If your test group doesn't significantly outperform your control group, your ads aren't adding any real value. You're just paying to reach customers who would have found you regardless.
This method completely bypasses the need for cookies or pixels. We're not tracking individuals; we're measuring the aggregate impact on a specific market. It gives us undeniable proof of our campaign's value, which is exactly the kind of clear, defensible data we need to make smart budget decisions. This is how you measure what works when the old rules no longer apply.
Measuring Your Brand's Purpose and Impact

As BillyBuzz has grown, we’ve realized that our definition of marketing effectiveness needs to evolve beyond the balance sheet. In a world where people actively choose brands that mirror their own values, a company's reputation and purpose have become serious drivers of customer loyalty.
It’s time to look past purely financial KPIs and start weaving purpose-driven metrics into how we measure performance.
This isn’t about feel-good PR campaigns. We’re talking about tangible indicators that tell us if our brand’s actions are actually connecting with our audience. It's a new way of learning how to measure marketing effectiveness—not just in dollars, but in the trust and respect we earn.
For instance, we're looking at how to track the real-world impact of our sustainability initiatives on brand preference. Or how our commitment to diversity in ad campaigns actually shifts customer sentiment. This is all about building a brand that's not just profitable but genuinely resilient.
Quantifying Brand Purpose
The tricky part, of course, is turning these big ideas into cold, hard numbers. It’s definitely not as straightforward as tracking cost-per-click, but solid frameworks are starting to emerge that connect a brand's purpose to its performance. We're keeping a close eye on the evolution of Marketing Mix Modeling (MMM) platforms to see how they're tackling this.
In fact, by 2025, the top analytics providers are expected to integrate purpose-driven indicators like Carbon Footprint Reduction, Workplace Diversity, and Social Return on Investment (SROI) directly into their measurement models. This change is huge. It gives marketers the tools to finally quantify success in terms of both revenue and societal contribution.
At its core, this is about measuring long-term brand health. A strong purpose can create a moat around your business that competitors can't easily cross with a bigger ad budget. It’s the ultimate defense.
We're now tracking these non-financial metrics right alongside our revenue goals, treating them as leading indicators of where our brand is headed.
Tying Sentiment to Action
A huge piece of this puzzle is understanding brand sentiment. How do people feel about BillyBuzz? Are our purpose-driven messages hitting the mark, or are they just noise? Answering these questions requires a much more nuanced approach than just staring at sales figures.
We use social listening and sentiment analysis tools to keep a pulse on the conversations happening around our brand. This gives us a direct line into the emotional response to our campaigns and company initiatives.
By tracking shifts in sentiment over time, we can start to draw a clear line between our purpose-driven marketing and real changes in public perception. To get a better handle on this, check out our guide on how AI improves brand sentiment benchmarking.
When we pull all these metrics together, we get a much richer, more complete picture. We can finally see how a campaign that highlights our company values doesn't just drive short-term leads but also builds long-term brand equity, making every future marketing dollar we spend work that much harder.
Frequently Asked Questions About Measuring Marketing
We get asked all the time by other founders how to get a real handle on their marketing performance. Here are some straight-up answers to the questions that pop up most often, based on our own hard-won experience.
What Is the Single Most Important Metric?
If I had to pick just one, it would have to be the LTV:CAC ratio (Lifetime Value to Customer Acquisition Cost). It’s the ultimate reality check for your entire business model.
Think about it: if you’re spending $100 to land a new customer who only ever brings in $150 of value, you’re on a fast track to nowhere. We learned early on to aim for a healthy ratio of at least 3:1. That’s the kind of margin that lets you build a truly profitable company, not just one that looks good on a growth chart.
What are some examples of your BillyBuzz lead generation playbook?
Since our core business is finding leads on Reddit, we live and die by our monitoring rules. Here’s a peek at what we actually do:
- Subreddits we monitor: We stay laser-focused on professional communities where our ideal customers hang out. Our top three are
r/sales,r/marketing, andr/smallbusiness. We avoid the noise of massive, general subreddits. - Alert Rules: We set up alerts in BillyBuzz for keywords that signal buying intent. Some of our highest-converting alerts are for phrases like "recommend a CRM," "social listening tool alternative," and "how to find leads." We also filter out noisy words like "free" or "intern" to improve signal quality.
- Response Template: When we find a relevant conversation, we don't spam a link. Our go-to template is based on adding value first:
- “Hey [Username], saw you were looking for [topic]. The key is often [actionable advice]. We actually built a tool, BillyBuzz, that automates [the hard part]. No pressure, but it might save you some time. Happy to answer any questions.”
This approach has a much higher engagement rate than a hard pitch.
- “Hey [Username], saw you were looking for [topic]. The key is often [actionable advice]. We actually built a tool, BillyBuzz, that automates [the hard part]. No pressure, but it might save you some time. Happy to answer any questions.”
How Often Should I Be Checking My Analytics?
This really depends on what you're looking at and why. You need to operate on two different speeds.
We keep a close eye on our high-level "health check" metrics—things like ad spend, site traffic, and conversion rates—on a daily or weekly dashboard. This is purely to spot any sudden fires that need putting out.
But for the deeper, more strategic stuff like LTV:CAC and overall channel ROI? That gets a proper, in-depth review monthly and quarterly. Getting bogged down in daily swings for long-term indicators is a classic mistake; it will only lead you to make panicked, short-sighted decisions.
Your attribution data is going to be messy at first. Everyone's is. Don't fall into the trap of trying to build a perfect multi-touch attribution model from day one. A simple, yet incredibly powerful first step is to use the Model Comparison Tool in GA4. Just compare the standard "Last Click" model to a "Linear" or "Data-Driven" one. This simple exercise will immediately give you a much richer perspective on which channels are assisting conversions, not just the ones that happen to get the final click.
At BillyBuzz, we save you hours of manual work by finding your next customers on Reddit before your competitors do. Start discovering relevant leads today.